Review Dashboard
Data managers review data, create queries, and resolve queries throughout the lifecycle of a clinical trial. DQS provides a dashboard that allows data managers to quickly navigate to data that has not yet been cleaned. The dashboard helps data managers take immediate action on discrepant data and efficiently track the progress of their data cleaning activities.
The Dashboard page displays summary information for each Review Listing in the Study, including record counts and status summaries for the following review statuses. It also shows two charts: Outstanding Queries and Outstanding Query Summary by Subject Status with counts of outstanding queries in the Study.
Prerequisites
Users with the standard CDMS Data Manager, CDMS Lead Data Manager, and CDMS Super User study roles can use the dashboard. If your organization uses user-defined Study Roles, your role must grant the following permissions:
| Type | Permission Label | Controls |
|---|---|---|
| Standard Tab | Workbench Tab | Ability to access and use the Data Workbench application, via the Workbench tab |
| Functional Permission |
If your Study contains restricted data, you must have the Restricted Data Access permission to view it.
Learn more about Study Roles.
Accessing the Dashboard
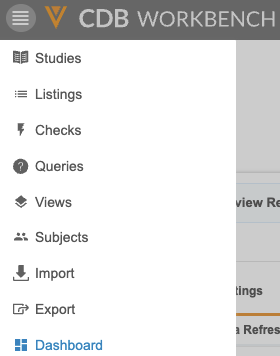
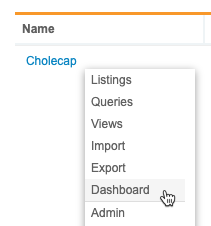
You can access the dashboard from the Dashboard page in DQS. You can navigate to the Dashboard page from the Navigation Drawer (), after you select your Study, or the Study menu () on the Studies page.
|
|
You can also access the Dashboard by clicking the Study Name in the Breadcrumb menu.
What’s Included in the Dashboard
On the Dashboard, Workbench shows details about the review status of records and the progression of review completion across individual, review-enabled listings. Workbench also details outstanding queries across the Study and by Subject Status, as well as queries created automatically by Checks, and the count of changed rows in the With Changes column.
The Dashboard pulls from all review-enabled listings. Review Listings with changes are considered incomplete in the Review Dashboard.
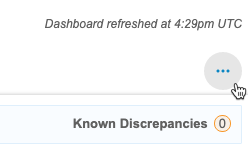
Dashboard Refresh: Workbench refreshes the dashboard’s Review Progress grid every sixty (60) minutes or when a newly imported data package is applied. Changes to Review Status don’t display in the dashboard until the next refresh occurs. Workbench refreshes the query charts as changes are made.
Review Listings
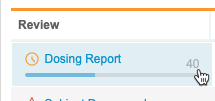
For each Review Listing, Workbench displays a progress bar representing the number of records in the Reviewed status out of the total number of records. The progress bar grows as review completion nears 100%. The number on the top-right side of the progress bar is the percentage for completion.
In the Summary panel, the progress bar for each Category shows review progress across all listings in that category.
In the list of Review Listings, Workbench displays the following columns:
- Review: Title of the listing
- Category: The Category assigned to the listing
- Record Count: The total number of records (rows) in that listing
- Not Reviewed: The number of records in the Not Reviewed review status
- In Progress: The number of records in the In Progress review status
- Reviewed: The number of records in the Reviewed status
- Known Discrepancy: The number of records in the Known Discrepancy status (having one or more Known Discrepancies)
- w/ Change: The number of records with detected changes. This includes rows with Reviewed, In Progress, and Known Discrepancy statuses.
- w/ Answered Queries: The number of records with at least one Query in the Answered status
- w/ Open Queries: The number of records with at least one Query in the Open status
- Data Refreshed: The date and time that the Review Listing was last refreshed.
You can click a listing’s Title (link in the Review column) to open the results for that listing.
Check Summary
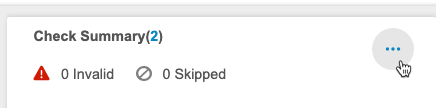
Workbench shows a summary of queries and protocol deviations created by Checks in the Check Summary widget.
For queries, this includes counts for the Invalid and Skipped check statuses, as well as the total number of Queries Generated, Open, Discrepancies (queries opened by checks), Answered, and Closed queries. You can click the link for one of the query statuses, or the total queries generated, to open a query listing showing those queries.
For protocol deviations, this includes counts for the Active and Inactive statuses, as well as the total number of Protocol Deviations opened. You can click the link for one of the statuses, or the total PDs generated, to open a listing showing those PDs.
Query Charts
Workbench shows two charts for queries in the dashboard. From these charts, you can click a Status to navigate to the associated queries.
-
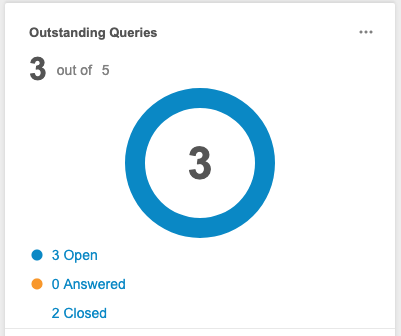
Outstanding Queries: Displays a donut chart of Open and Answered queries, as well as a count of queries in each Query Status below the chart.
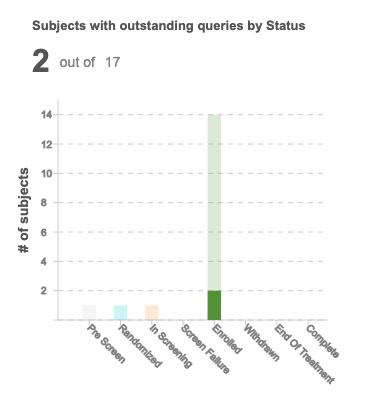
-
Subjects with Outstanding Queries by Status: Displays a stacked bar chart of Subjects with and without outstanding queries across the Pre Screen, Randomized, In Screening, Screen Failure, Enrolled, and Withdrawn subject statuses
Hide & Show the Summary Panel
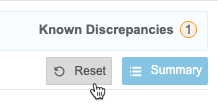
You can hide the Summary panel. Click Close ().

To show it again, click Summary.
Hide & Show Query Charts
You can hide the Check Summary and Query Charts. Click Hide Queries ().
To show it again, click Show Queries ().
Sorting & Filtering the Dashboard
By default, Workbench displays listings of all categories. In the Category section of the Summary panel, you can choose a Category to show only listings within that Category.
Quick Filters
You can filter the list of listings by the Status of the listing. For each Status, Workbench shows a count of listings in that status in the filter label. Filter options include:
- Not Started
- In Progress
- Invalid
- Complete
- w/ Warnings
- Disabled
Click a filter option to apply it.
Workbench displays applied filters in the Filtered By list.
To clear a filter, click Remove () in that filter’s pill.
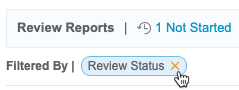
To remove all applied filters, click Reset.
Sort & Filter by Column Values
You can sort and filter the list of listings by the following columns:
- Category
- Record Count
- Not Reviewed
- In Progress
- Reviewed
- Known Discrepancy
- w/ Change
- w/ Answered Queries
- w/ Open Queries
- Data Refreshed
If a column already has a sort or filter applied, Workbench shows the Sort icon ( for ascending or for descending) and the Filter icon (filter_list). You can click these in the Column Header to edit the sort or filter. You can also sort and filter columns that don’t already have a sort and filter.
How to Sort
To sort the list:
- Navigate to the Dashboard for your Study.
- Locate the column you want to sort by.
- In that column, hover to show the Sort & Filter button.
- Click Sort & Filter (filter_list).
- Click to expand Sort by.
- Select Ascending or Descending for the sort order.
- Click OK.
How to Filter
To filter the list:
- Navigate to the Dashboard for your Study.
- Locate the column you want to sort by.
- In that column, hover to show the Sort & Filter button.
- Click Sort & Filter (filter_list) .
- Click to expand Condition.
- Select an Operator. Workbench uses the entered Value and chosen Operator to compare the values within the column. Learn more about the available comparison operators in the CQL Reference.
- If required, enter a Value compare values against. Note that you can only use a static value and not a function. For dates, use the YYYY-MM-DD format.
- Click OK.
How to Reset a Filter
To reset (remove) a filter from a column, open the Sort & Filter menu for that column and click Clear.
Download the Progress Report
You can run a progress report on your study’s review status from the dashboard. The progress report includes the following information for each listing:
- Review Listing (listing’s Title)
- Category
- Objective
- Review Progress
- Reviewed
- Not Reviewed (count of rows in the No Review and Unreviewed statuses)
- In Progress
- Known Discrepancy
- Listing Review Status
- Records with Answered Queries
- Records with Open Queries
- Last Run
- Last Refresh
- Bulk Lock & Freeze Creation Status
- Low Threshold Counter (indicates the number of times that the review listing refresh took less than 30 seconds)
- High Threshold Counter (indicates the number of times that the review listing refresh took more than 90 seconds)
To download the progress report:
- Navigate to the Dashboard page.
-
- From the Dashboard menu (), select Download Progress Report.
-

- Workbench begins a job to create the CSV file. When finished, Workbench shows a notification with a link to download the CSV in the bottom-left corner of the screen. You can click this link to download the CSV file.
Scheduled Progress Reports: An admin user can schedule a recurring progress report to be sent to a configured list of users. Learn more.
Download the Object Summary
The Object Summary contains a CSV file for Listings and Views. These list details about the approval and deployment of these objects.
Each CSV contains the following columns:
- Vault ID
- Study Name
- Object ID
- Type
- Source(s)
- Object Name
- Object Short Name
- Category
- Description
- Objective
- CQL Syntax
- Created By
- Created On
- Last Modified By
- Last Modified On
- Current Status
- Approved By
- Approved On
- Approved Comments
- Deployed By
- Deployed On
- Deployed Comments
To download the object summary:
- Navigate to the dashboard Dashboard page.
-
From the Dashboard menu (), select Download Object Summary.
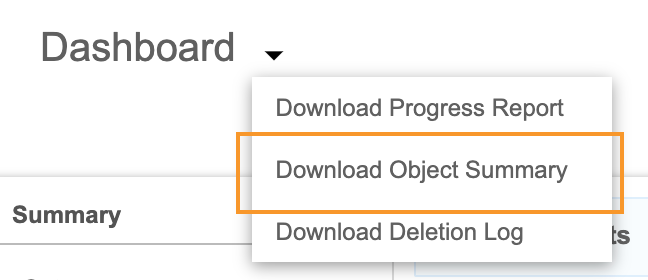
- Workbench begins a job to create the CSV file. When finished, Workbench shows a notification with a link to download the CSV in the bottom-left corner of the screen. You can click this link to download the CSV file.
Download the Deletion Log
The Deletion Log acts as an audit trail for the deletion of objects in DQS. This log records deletion and any reasons for deletion that users entered.
The deletion log contains the following columns:
- Vault Id
- Study Name
- Type
- Reviewable
- Access
- Object Name
- Category
- Source
- Object
- Short Title
- Description
- Objective
- CQL Syntax
- Created By
- Created on
- Last Modified by
- Last Modified on
- Last Modified in
- Current Status
- Approved by
- Approved on
- Approved Comments
- Deployed by
- Deployed on
- Deployed Comments
- Deleted by
- Deleted on
- Deleted Comments
- Cloned From
- Clone Modified
- CDB Object
- GUID
- CDB Source Object ID
- Check Action
- Check Message
To download the Deletion Log:
- Navigate to the dashboard Dashboard page.
-
From the Dashboard menu (), select Download Deletion Log.
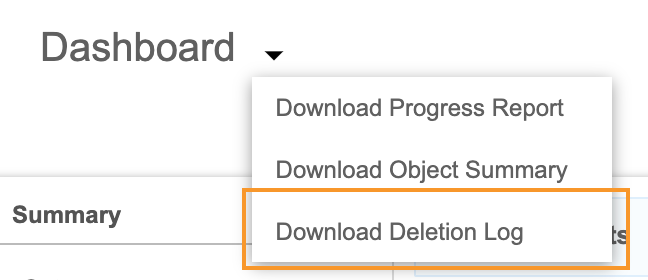
- Workbench begins a job to create the CSV file. When finished, Workbench shows a notification with a link to download the CSV in the bottom-left corner of the screen. You can click this link to download the CSV file.