Using Metrics
Veeva DQS offers Metrics, which support the risk-based quality management of your Study through tracking Key Risk Indicators (KRIs) and Quality Tolerance Limits (QTLs) that enable you to identify departures from acceptable risk ranges. In a clinical study, Metrics enable you to monitor and mitigate risks that might impact patient safety, data integrity, or study outcomes. You can easily create metrics to define, visualize, and monitor the Key Risk Indicators (KRIs) and Quality Tolerance Limits (QTLs) at the study, site, country, or subject level, accelerating identification and resolution of potential issues. Metrics are refreshed daily in Production environments, to provide up-to-date information about study data risks from within DQS Workbench, eliminating the need to spend time configuring and maintaining external metrics tracking.
Accessing Metrics
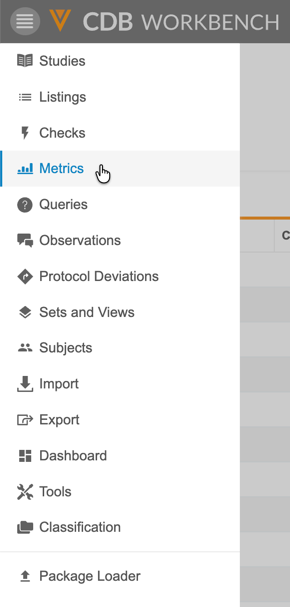
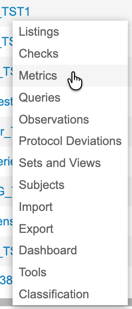
You can access metrics from the Metrics section of Veeva DQS. You can navigate to the Metrics area from the Navigation Drawer () or, after you select your Study, from the Study Actions menu () on the Studies page.
|
|
You can sort and filter the Metrics listing page like other listings pages in DQS.
How to Open a Metric
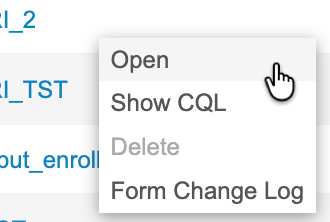
From the Metrics page, you can click a metric’s Title to open the Metric. You can also open a Metric from the Metric menu:
-
Navigate to Metrics for your Study.
-
Locate the Metric that you want to open in the list.
-
Hover over the Title to show the Metric menu.
-
From the Metric menu, select Open.
Search for a Metric
You can search for a specific metric, using the Title, Category, Objective, Description, Source, and Status columns. This search uses “contains”.
To search:
-
Navigate to your Study in Workbench.
-
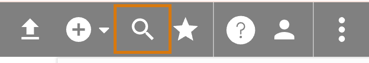
In the top navigation bar, click Search ().
-
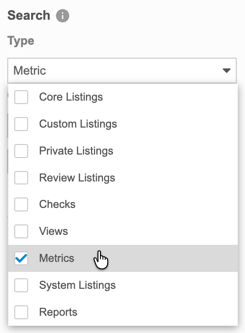
By default, Workbench searches across all object types. You can select and clear checkboxes in the Type drop-down to change which objects Workbench is searching.
-
Select the Column to search. The default is Title.
-
Enter your Search Text.
-
Click Search or press Enter to search.
-
Click the metric Title in the Results section to open it.
Workbench shows your search results in the Results section of the Search panel.
Click Close () to close the Search panel.
Sort & Filter
You can sort and filter the Metrics page by the following columns:
- Title
- Current Status
- Category
- Objective
- Created On
- Created By
- Modified On
- Modified By
If a column already has a sort or filter applied, Workbench shows the Sort icon ( for ascending or for descending) and the Filter icon (filter_list). You can click these in the Column Header to edit the sort or filter. You can also sort and filter columns that don’t already have a sort and filter.
Sorting the Metric Listing
In both the Defined and Undefined subtabs, you can sort the metrics listing.
To sort the metrics listing:
- Hover over the column header for the column you want to sort by.
- Click Sort (filter_list) to open the Sort menu.
-
Under Sort By, click Ascending or Descending.
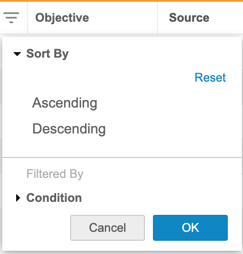
- Click OK.
If a column already has a sort order applied, Workbench shows the Sort icon ( for ascending or for descending). You can click these in the Column Header to change or remove the sort order.
To reset (remove) the sort order, open the Sort menu and click Reset.
Filtering the Metrics Listing
In both the Defined and Undefined subtabs, you can filter the metrics listing.
To filter the metrics listing:
- Hover over the column header for the column you want to sort by.
- Click Sort (filter_list) to open the Sort menu.
-
Under Condition, select the condition you want to filter by.
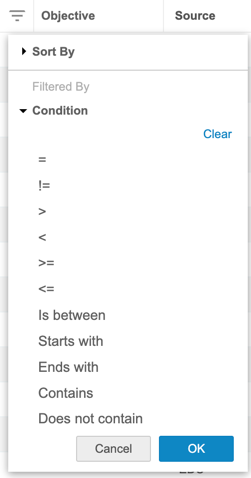
- Click OK.
To remove the filter, open the Sort menu and click Clear under Condition.
Creating & Editing Metrics
To create a metric, you must have a custom listing with at least one of each following column types:
- At least one item in a “GROUP BY” statement
- At least one numeric or integer column.
If either of these column types is missing, the system will display an error message when you try to save the listing as a metric.
You can create a metric from a custom listing with the required column types by saving it as a metric. Metric creation has two steps:
- Save the custom listing as a metric.
- Define the statistical configuration of the metric.
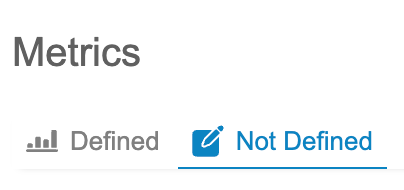
If you exit the metrics definition process before saving it, the metric is saved as Not Defined. Metrics that are in Not Defined status can be viewed and edited through the Not Defined subtab in the Metrics page.
Creating Metrics
To create a metric:
- Create a Custom Listing with the fields and groupings you want to include in your metric.
- Navigate to your Custom Listing.
-
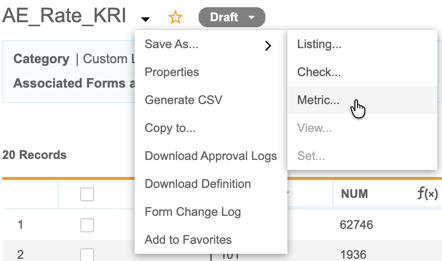
From the listing’s Actions menu, hover over Save As and click Metric.
-
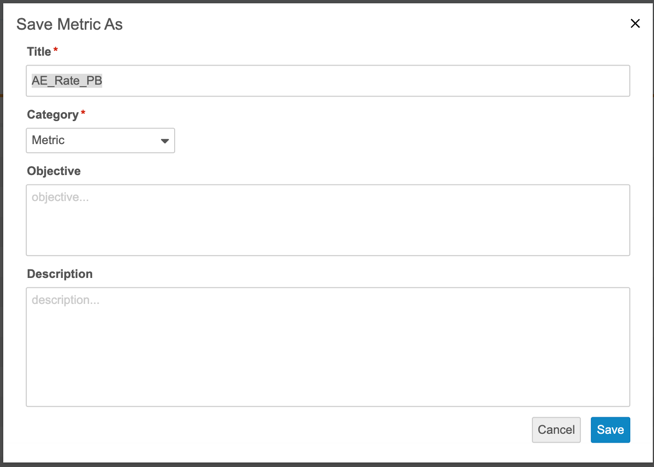
In the Save Metric As dialog, enter a Title and Category. Optionally enter an Objective and Description for your metric. The Title cannot contain any spaces.
-
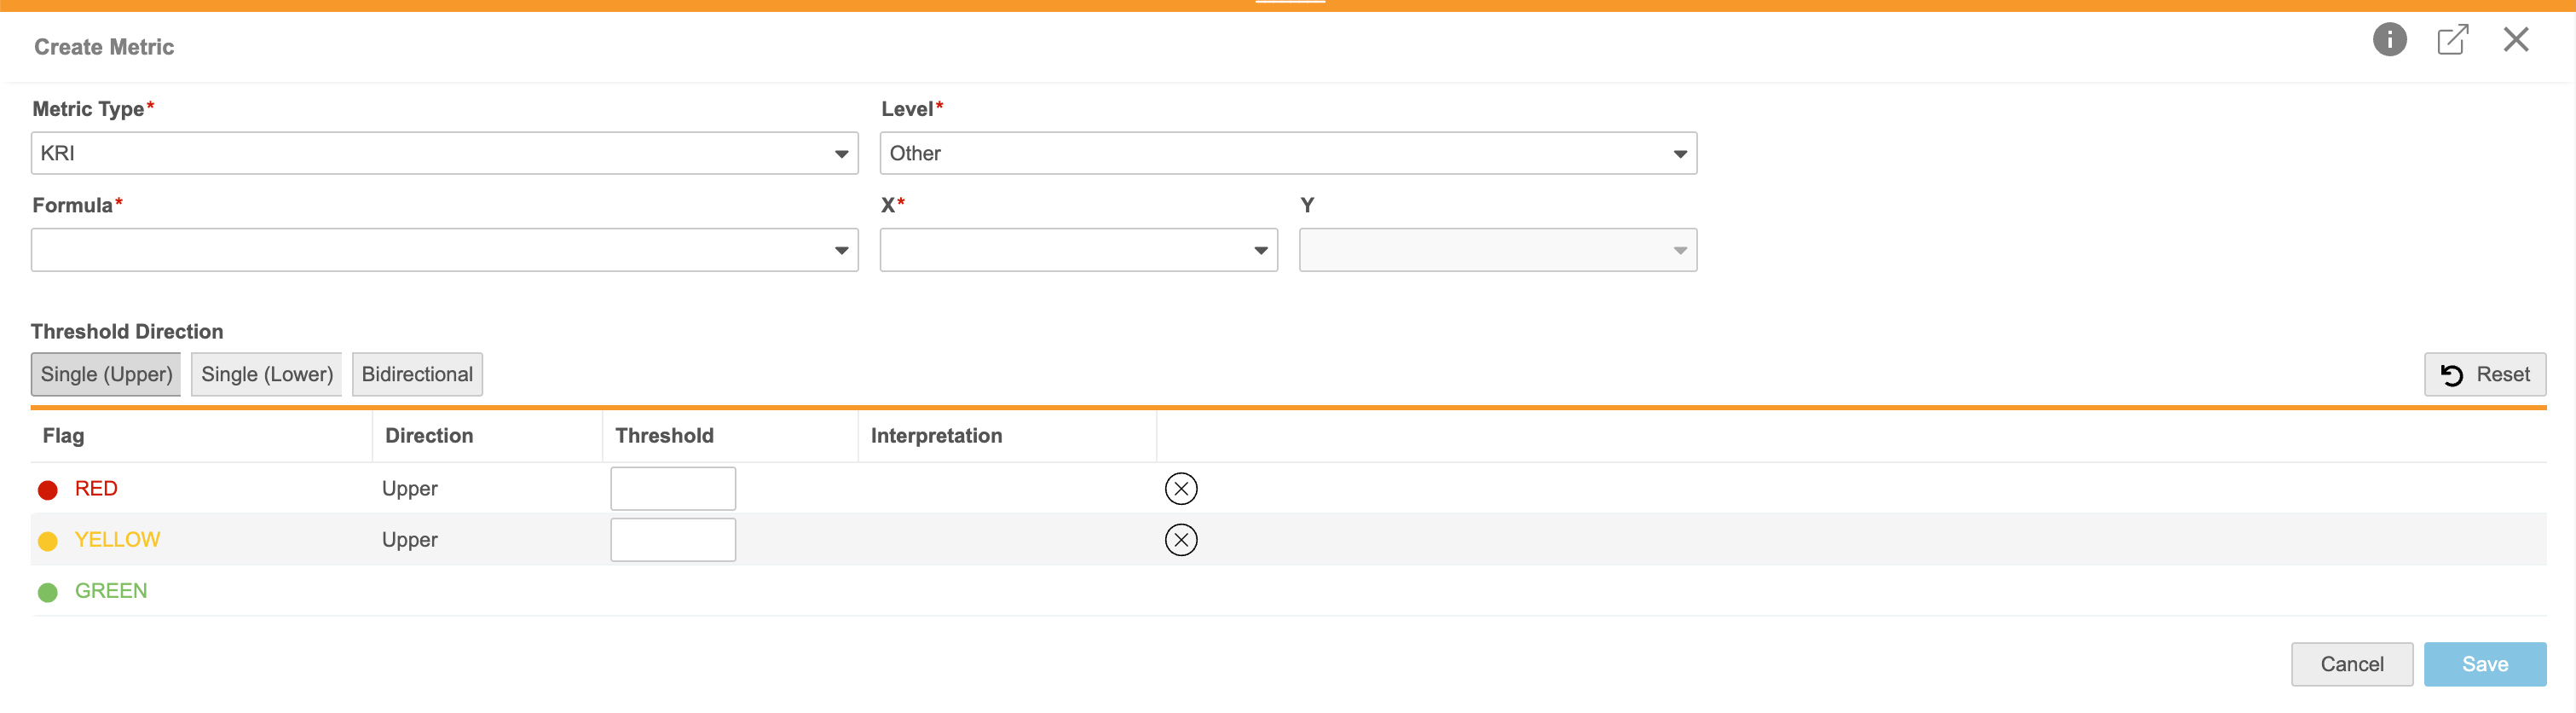
Click Save. The Create Metric page opens. If you exit the metric creation workflow at this point, the metric will be saved in Not Defined status. Any Create Metric properties you have entered will not be saved.
-
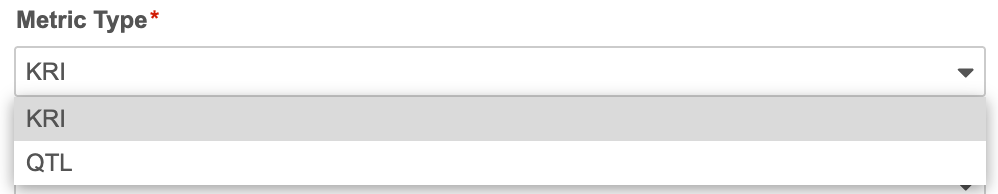
In the Create Metric page, select a Metric Type.
-
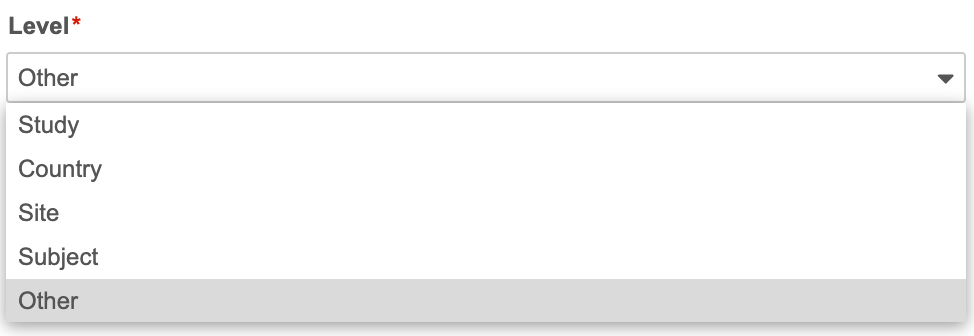
Select a Level for your metric.
-
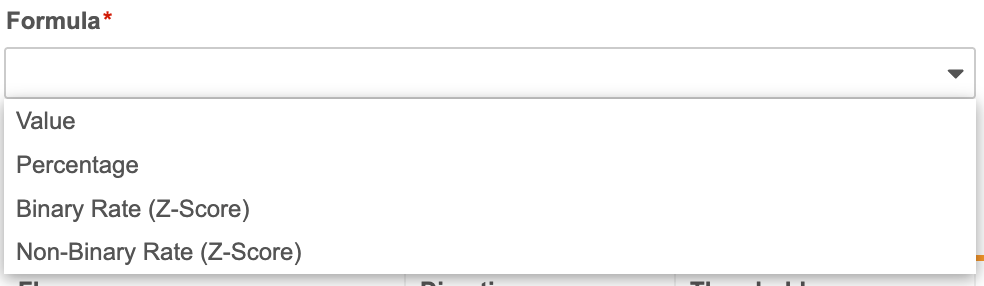
Select a Formula.
-
Select the column that is X in your formula.
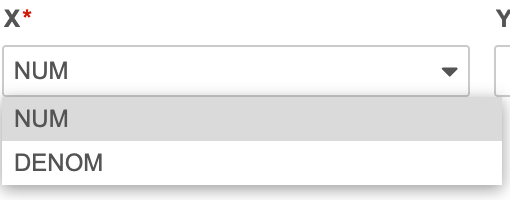
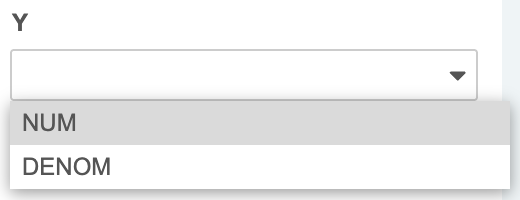
-
(For all metrics that do not use Value as the formula) Select the column that is Y in your formula.
-
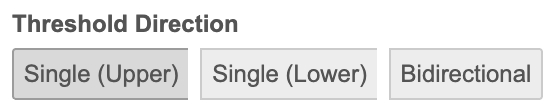
Select a Threshold Direction. You can configure Upper, Lower, or Upper and Lower (bidirectional) thresholds.
-
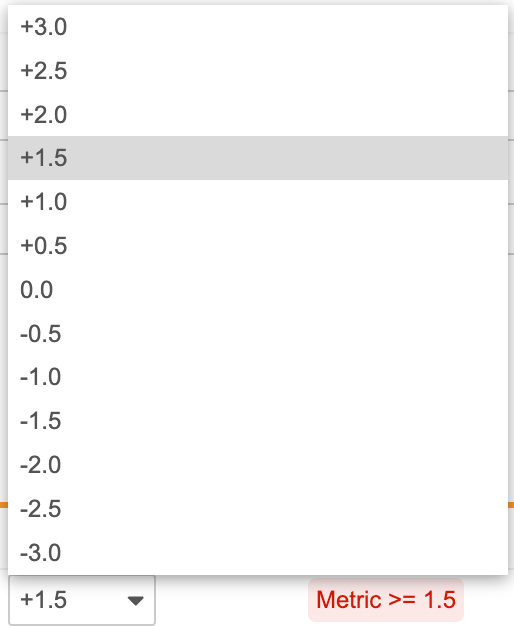
Select the Threshold. The available threshold options depend on the selected Formula. You must define at least 1 threshold for single direction thresholds and 2 thresholds for bidirectional thresholds. You can define up to 2 thresholds for single direction thresholds and up to 4 for bidirectional thresholds.
- (Optional) Click the Delete icon () to remove thresholds.
- Click Save.
Metric Configuration Options
Metric Type
The following table describes the available Metric Types:
| Metric Type | Description | Notes |
|---|---|---|
| KRI | Key Risk Indicator: within a risk-based quality management framework, evaluates data at specific levels of the Study to identify deviations from the acceptable risk range. | This classification is for indication only and does not influence the underlying metric calculation. |
| QTL | Quality Tolerance Limit: within the risk-based quality management framework, is defined at the overall Study level to identify systemic study data issues across the study as a whole. | This classification is for indication only and does not influence the underlying metric calculation. |
Levels
The following table describes the available levels a metric can be configured for:
| Level | Description |
|---|---|
| Study | Tracks data across the study as a whole. |
| Site | Tracks data by site. |
| Country | Tracks data at the study country level. |
| Subject | Tracks data at the subject level. |
| Other | Customizable classification, when the grouping criteria does not match any of the other levels. |
Formula
The following table describes the available metric formulas:
| Formula | Description | Notes |
|---|---|---|
| Value | A simple count of the occurrences of the column configured as X. | Value is best used for metrics where the event of interest is a simple count of occurrences of a specific criteria. Sample Calculation: Metric = X |
| Percentage | The calculated percentage of X as part of Y. | Percentage is best used to calculate metrics where the threshold is a fixed goal or standard, rather than relative to the rest of the study. Sample Calculation: Metric = (X/Y) * 100 |
| Binary Rate (Z-Score) | For events that occur at most once per subject, the statistical rate adjusted for sample size. | Binary Rate is best used to calculate metrics where the event of interest occurs once per subject. Sample Calculation: Metric = X/Y vMu = sum(X) / sum(Y) z0 = (Metric - vMu) / √(vMu * (1-vMu)/ Y) phi = mean(z0^2) Score = (Metric - vMu) / √(phi * vMu * (1-vMu) / Y) |
| Non-Binary Rate (Z-Score) | For events that can occur more than once per subject, the weighted statistical rate adjusted for sample size. | Non-Binary Rate is best used to calculate metrics where the event of interest may occur multiple times per subject. Sample Calculation: Metric = X/Y vMu = sum(X) / sum(Y) z0 = (Metric - vMu) / √(vMu / Y) phi = mean(z0^2) Score = (Metric - vMu) / √(phi * vMu / Y) |
Threshold Direction
The dynamic threshold changes depending on the formula that is selected.
The following table describes the available threshold directions:
| Direction | Description | Notes |
|---|---|---|
| Single (Upper) | Flags are triggered when the metric exceeds the defined upper limits. | Operators for Upper thresholds are always ≥ Green is derived as less than (<) the input of the row above it |
| Single (Lower) | Flags are triggered when the metric falls below the defined lower limit. | Operators for Lower thresholds are always ≤ Green is derived as greater than (>) the input of the row below it |
| Bidirectional | Flags are triggered when the metric either exceeds the defined upper limit or falls below the defined lower limit. | Operators for Upper Thresholds are always ≥ and operators for Lower thresholds are always ≤ Green is derived as between the input of the row below it and input of the row above it |
Editing Metrics
You can edit several of the properties of a metric after creating it, including the following:
- Metric Type
- Formula, if the number of variables in the new formula is equal to the number of variables in the existing formula
- Level
- Threshold values for the existing formula or a newly selected formula
You cannot edit the following attributes once the metric has been created:
- X and Y variables
- Listing
- Grouping
If you want to use different X and Y variables, a different listing, or a different grouping in your metric, you must create a new metric based on the same listing with the desired selections.
Editing Underlying Metrics Data: To edit the underlying data that is used in your metric, you must edit the original listing, create a new metric, and then delete the previous metric.
To edit a metric:
- Navigate to the Metrics page for your study using either the Study Menu or the Navigation Drawer.
- Click the Title of the metric you want to edit to open it.
-
From the Actions menu () click Modify Metric.
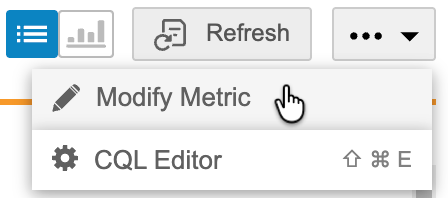
-
In the Create Metric dialog, make your desired changes.
- Click Save.
Approving and Deploying Metrics
You can deploy up to 50 metrics per study. Learn more about approving and deploying metrics.
Viewing & Visualizing Metrics
You can view and visualize your metrics to easily identify flagged data that meets the thresholds configured for your metric. A stacked bar chart visualization is supported for metrics with fewer than 200 groupings. If your metric has more than 200 groupings, you can apply filters to the metric columns to reduce the number of groupings to under 200 groupings. Metrics are refreshed daily in production environments, and can be manually refreshed every 15 minutes in test environments.
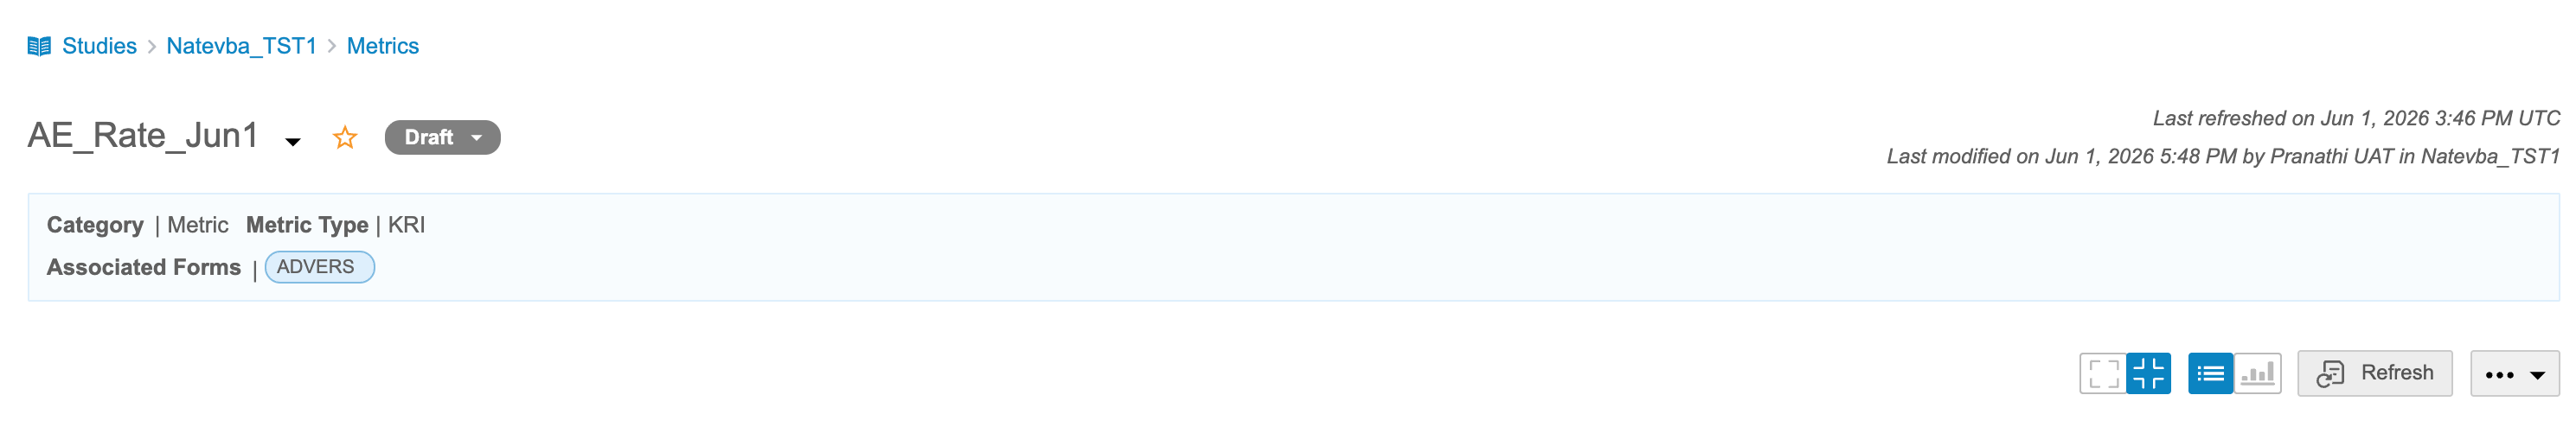
Listing Header
Like a Listing header, the Metric page’s header displays the Category, Objective, and Associated Forms for the metric. The Category and Objective are defined during metric creation, and the associated Form is defined when creating the originating custom listing. Dates displayed in the header include the following:
- Last Refreshed on [Date]: The date the metric was last refreshed.
- Last modified on [Date]: The date the metric was last modified.
To view a metric:
- Navigate to the Metrics page for your study using either the Study Menu or the Navigation Drawer.
- Click the Title of the metric you want to view to open it.
- The Metric listing opens displaying records and their associated Flag colors.
- (Optional) Sort or Filter by columns in your metric. Metrics data can be sorted and filtered like other listing data.
-
Click the Chart View button to view a stacked bar chart visualization of the data.
-
The metric visualization page loads. The X-axis is the grouping. Threshold lines are plotted for the upper and lower yellow and red thresholds. Groupings displayed in the visualization are based off of any applied filters in the table view.
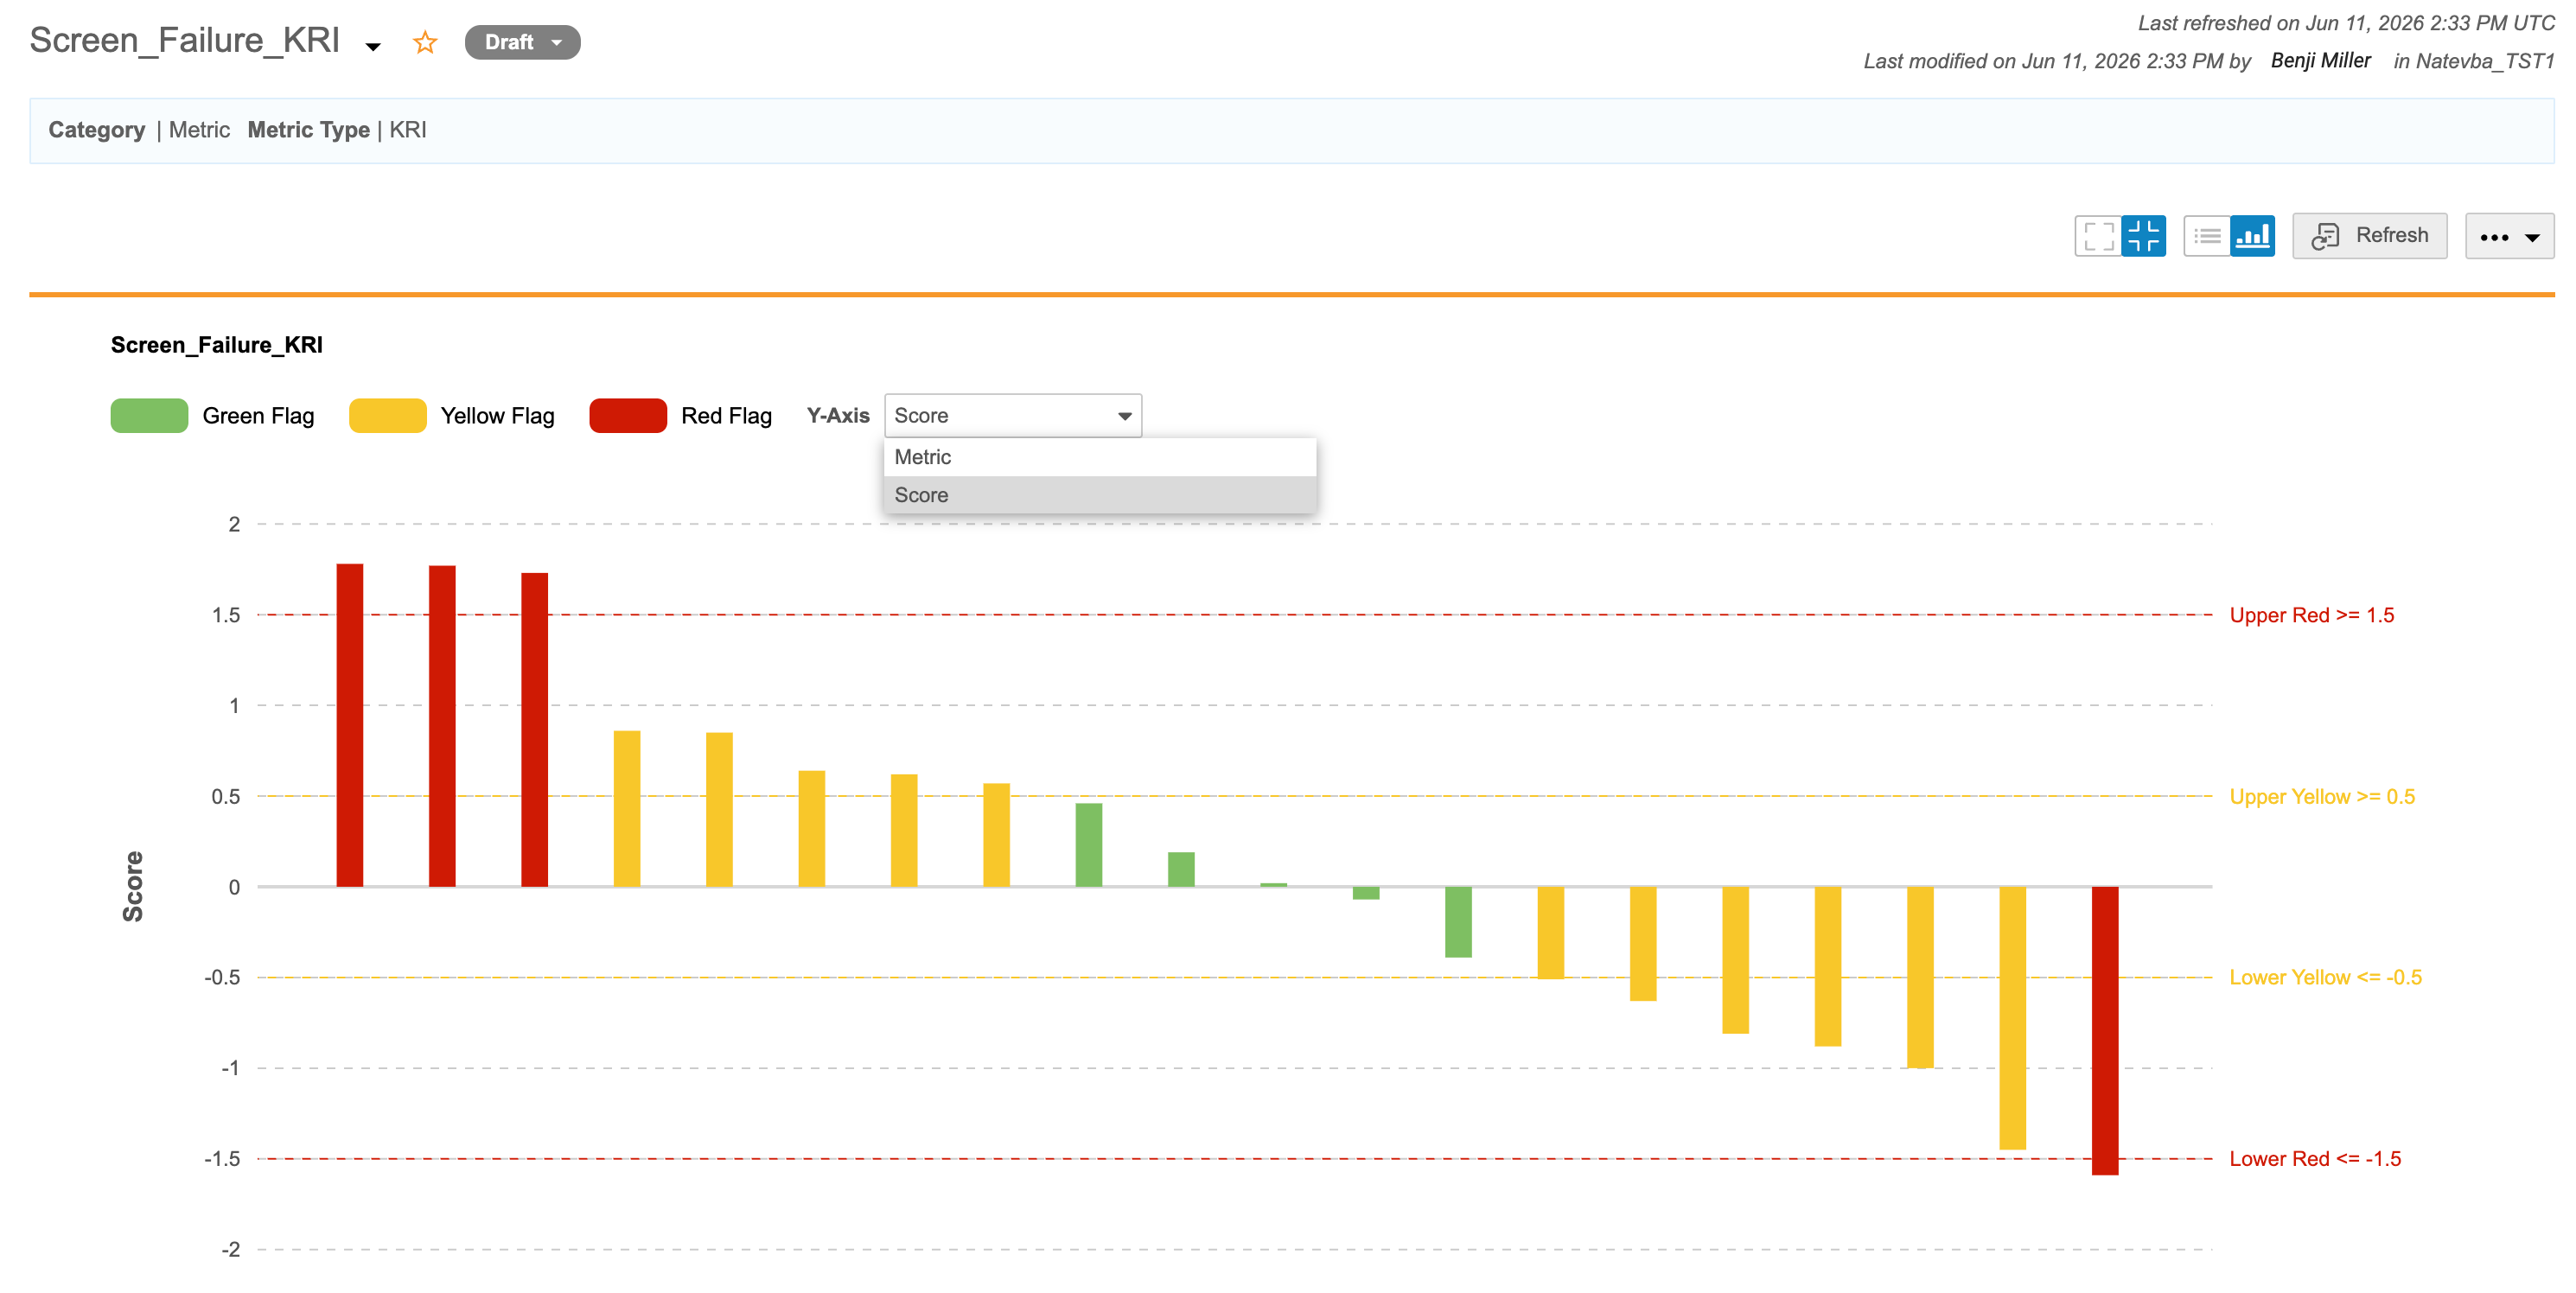
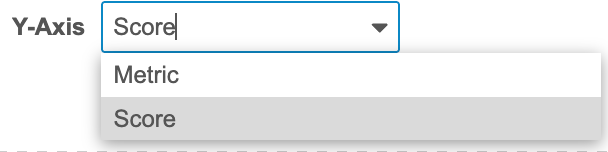
- (Optional: for Binary Rate and Non-Binary Rate formulas.) Click the dropdown for the Y-axis to toggle between the Score and Metric.
Limitations
The following limitations apply for metrics:
- Each Metric must have a unique name.
- Metrics cannot be saved as a View, Set, Listing (Review or Custom), or a Check.
- Metrics cannot be joined to other items or referenced in CQL.
- Views, Sets, Core Listings, Review Listings, and Checks cannot be saved as Metrics. You can only create and save Metrics from Custom (Private or Public) Listings.
- Metrics cannot have PDs, observations, or queries created or viewed on them.
- A maximum of 50 Metrics can be created per study.
- If any of the input variables contain blinded data at the form or column level, or if there is row-level blinding applied to any rows in the metric input data, the entire metric will be blinded regardless of any conditional unblinding rules. Users who do not have access to blinded data will still see the metric in the metrics page list, but will be unable to view the metric data and will instead see a UI message that the metric is blinded.